Programmable ECU for Automotive: SmartWheelsV1
Specifications & Features of JLink V9 Debugger Emulator: –
- Type C cable Powered and connection to Host Desktop/Laptop
- Works on SWD protocol for programming and debugging the NXP S32K1xx and NXP S32K3xx Series of MCU’s.
- Configured as Jlink Debugger for Programming/Debugging via S32 Design Studio/FreeMaster/ MBDT/Jlink Software Toolchain
- 2 Debug Connectors to connect to Host NXP Semiconductors S32K Microcontroller’s: 20 Pin JTAG and 10 Pin SWD connector
- Power configurable to Host NXP S32K MCU between 3.3 V and 5V.
- Can provide 3.3V or 5V and uptp 1A current for the development board by powering the S32K MCU via ProBug Debugger.
- Onboard Reset Button to reset the Host NXP S32K MCU via Debugger and also Power/Communication LEDs.
- Virtual UART COM Port Detection via same Debug connector for logging Realtime data via UART Peripheral.
product description
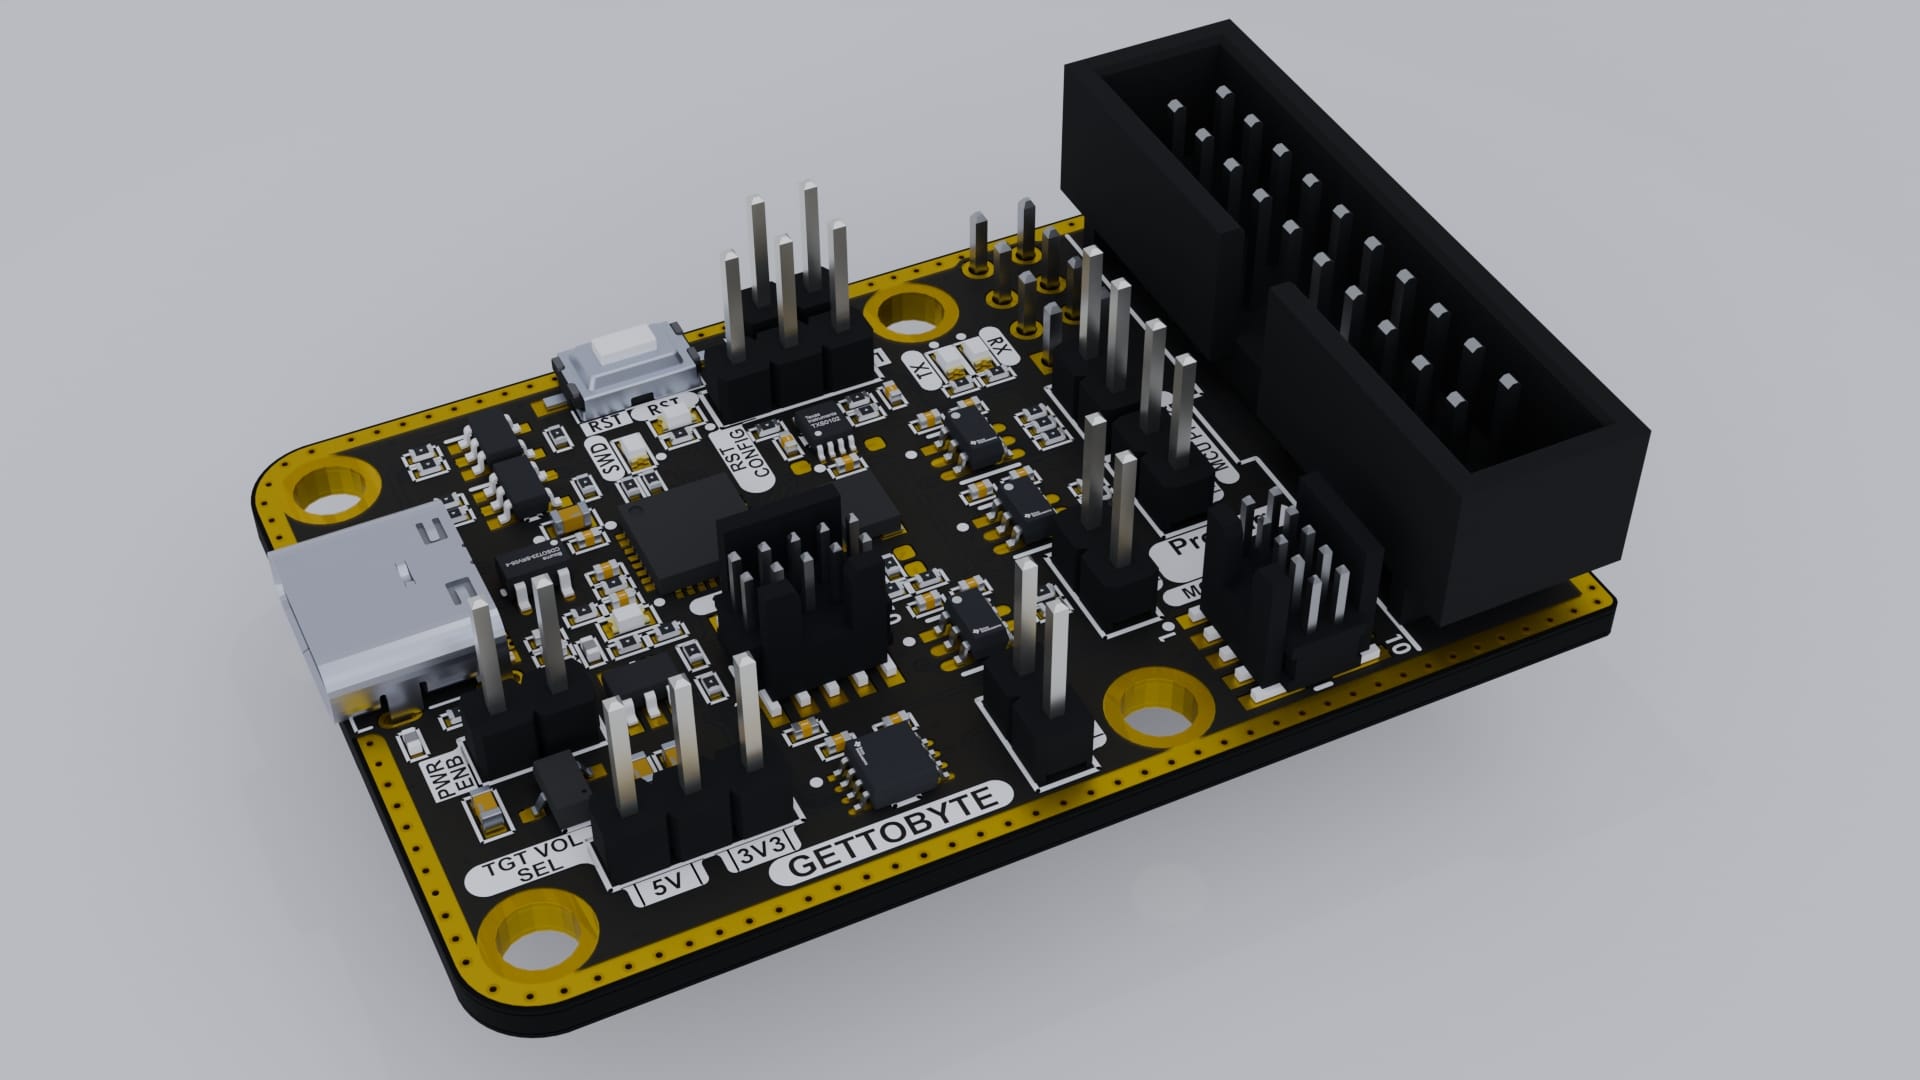
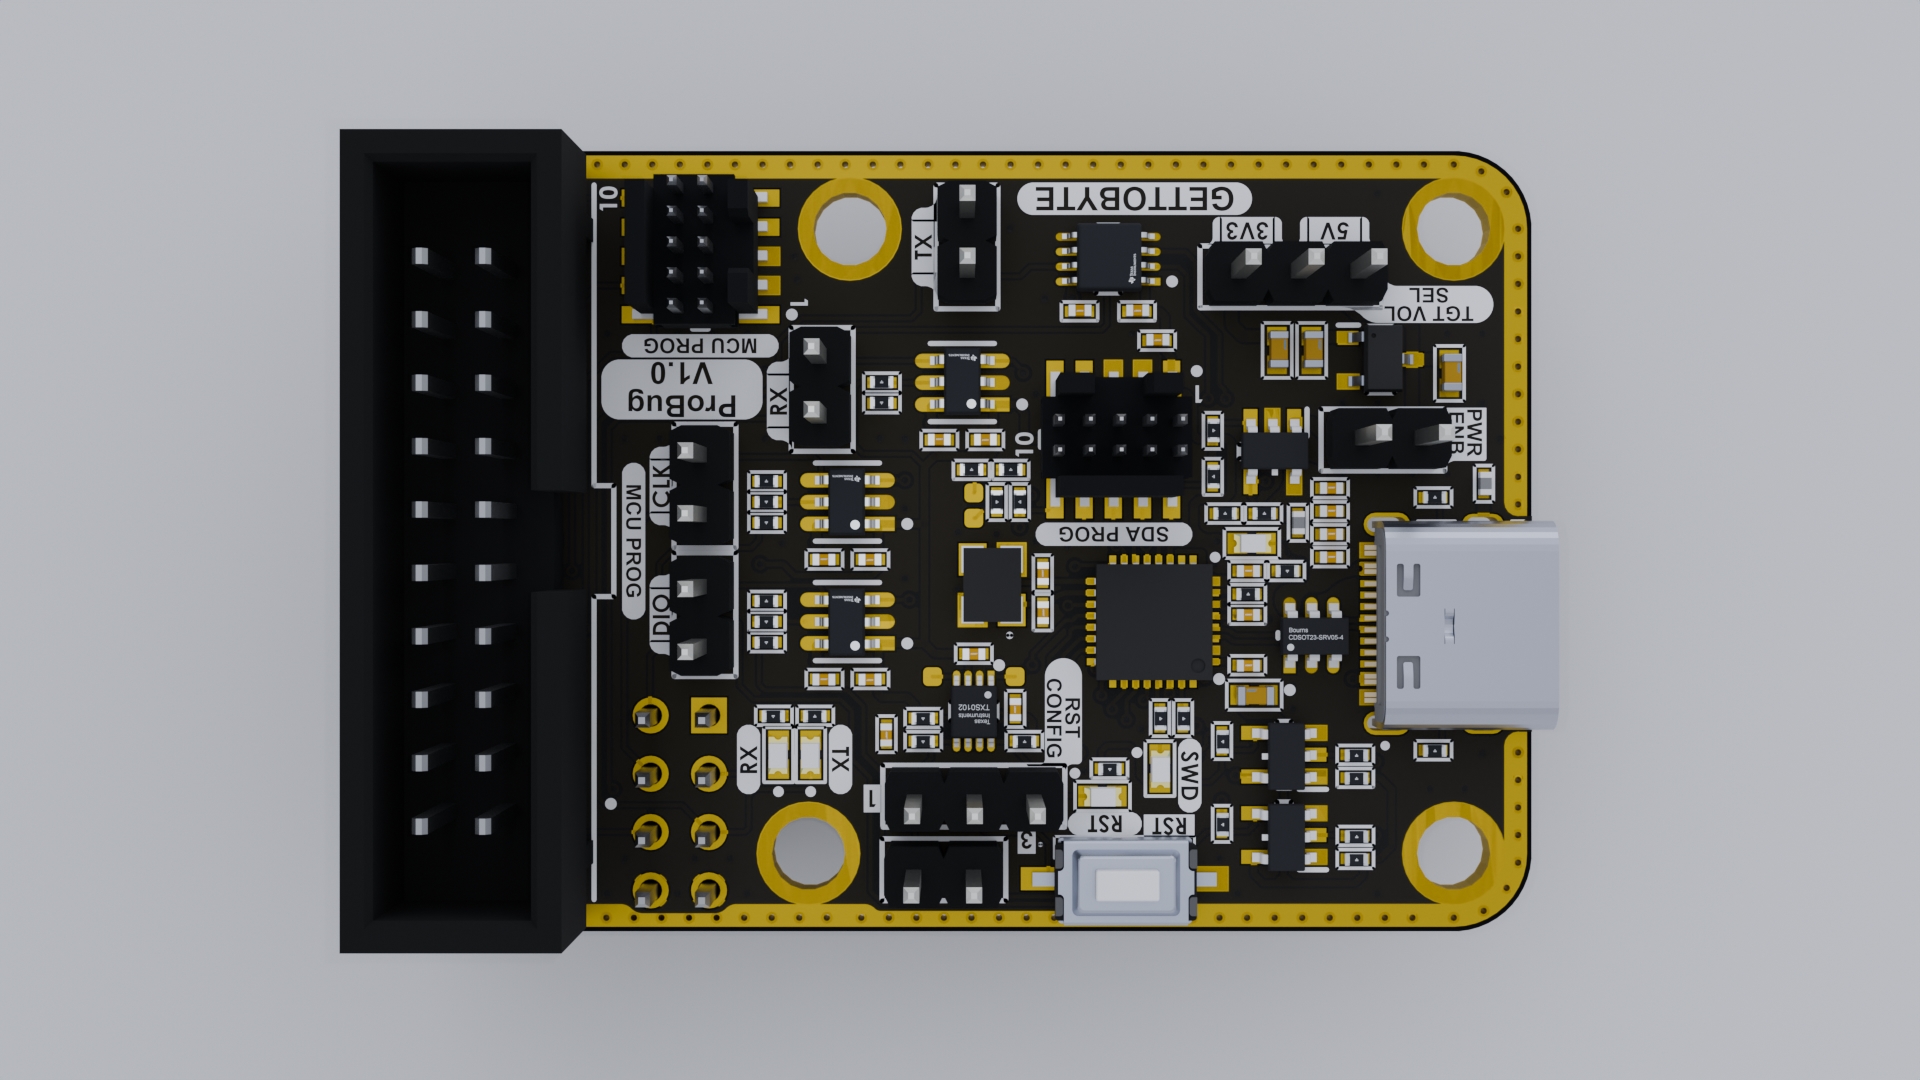
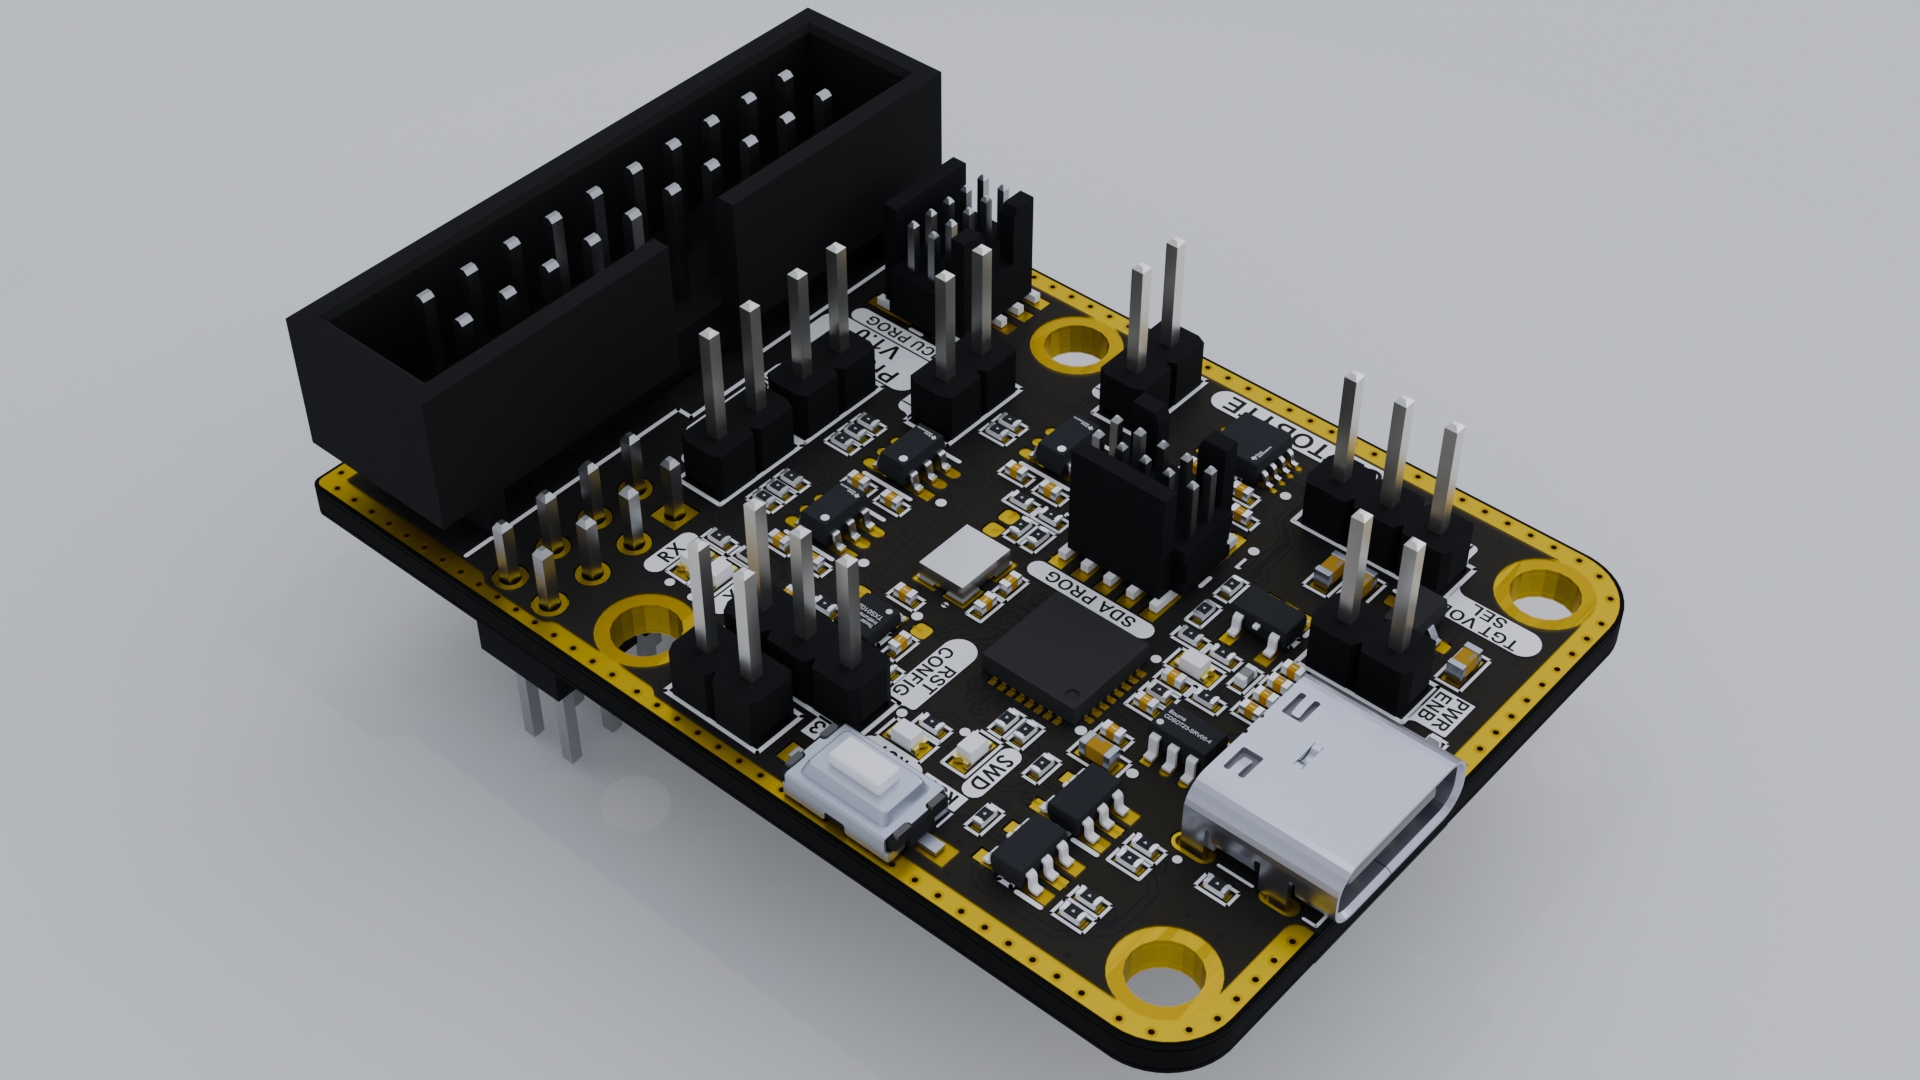
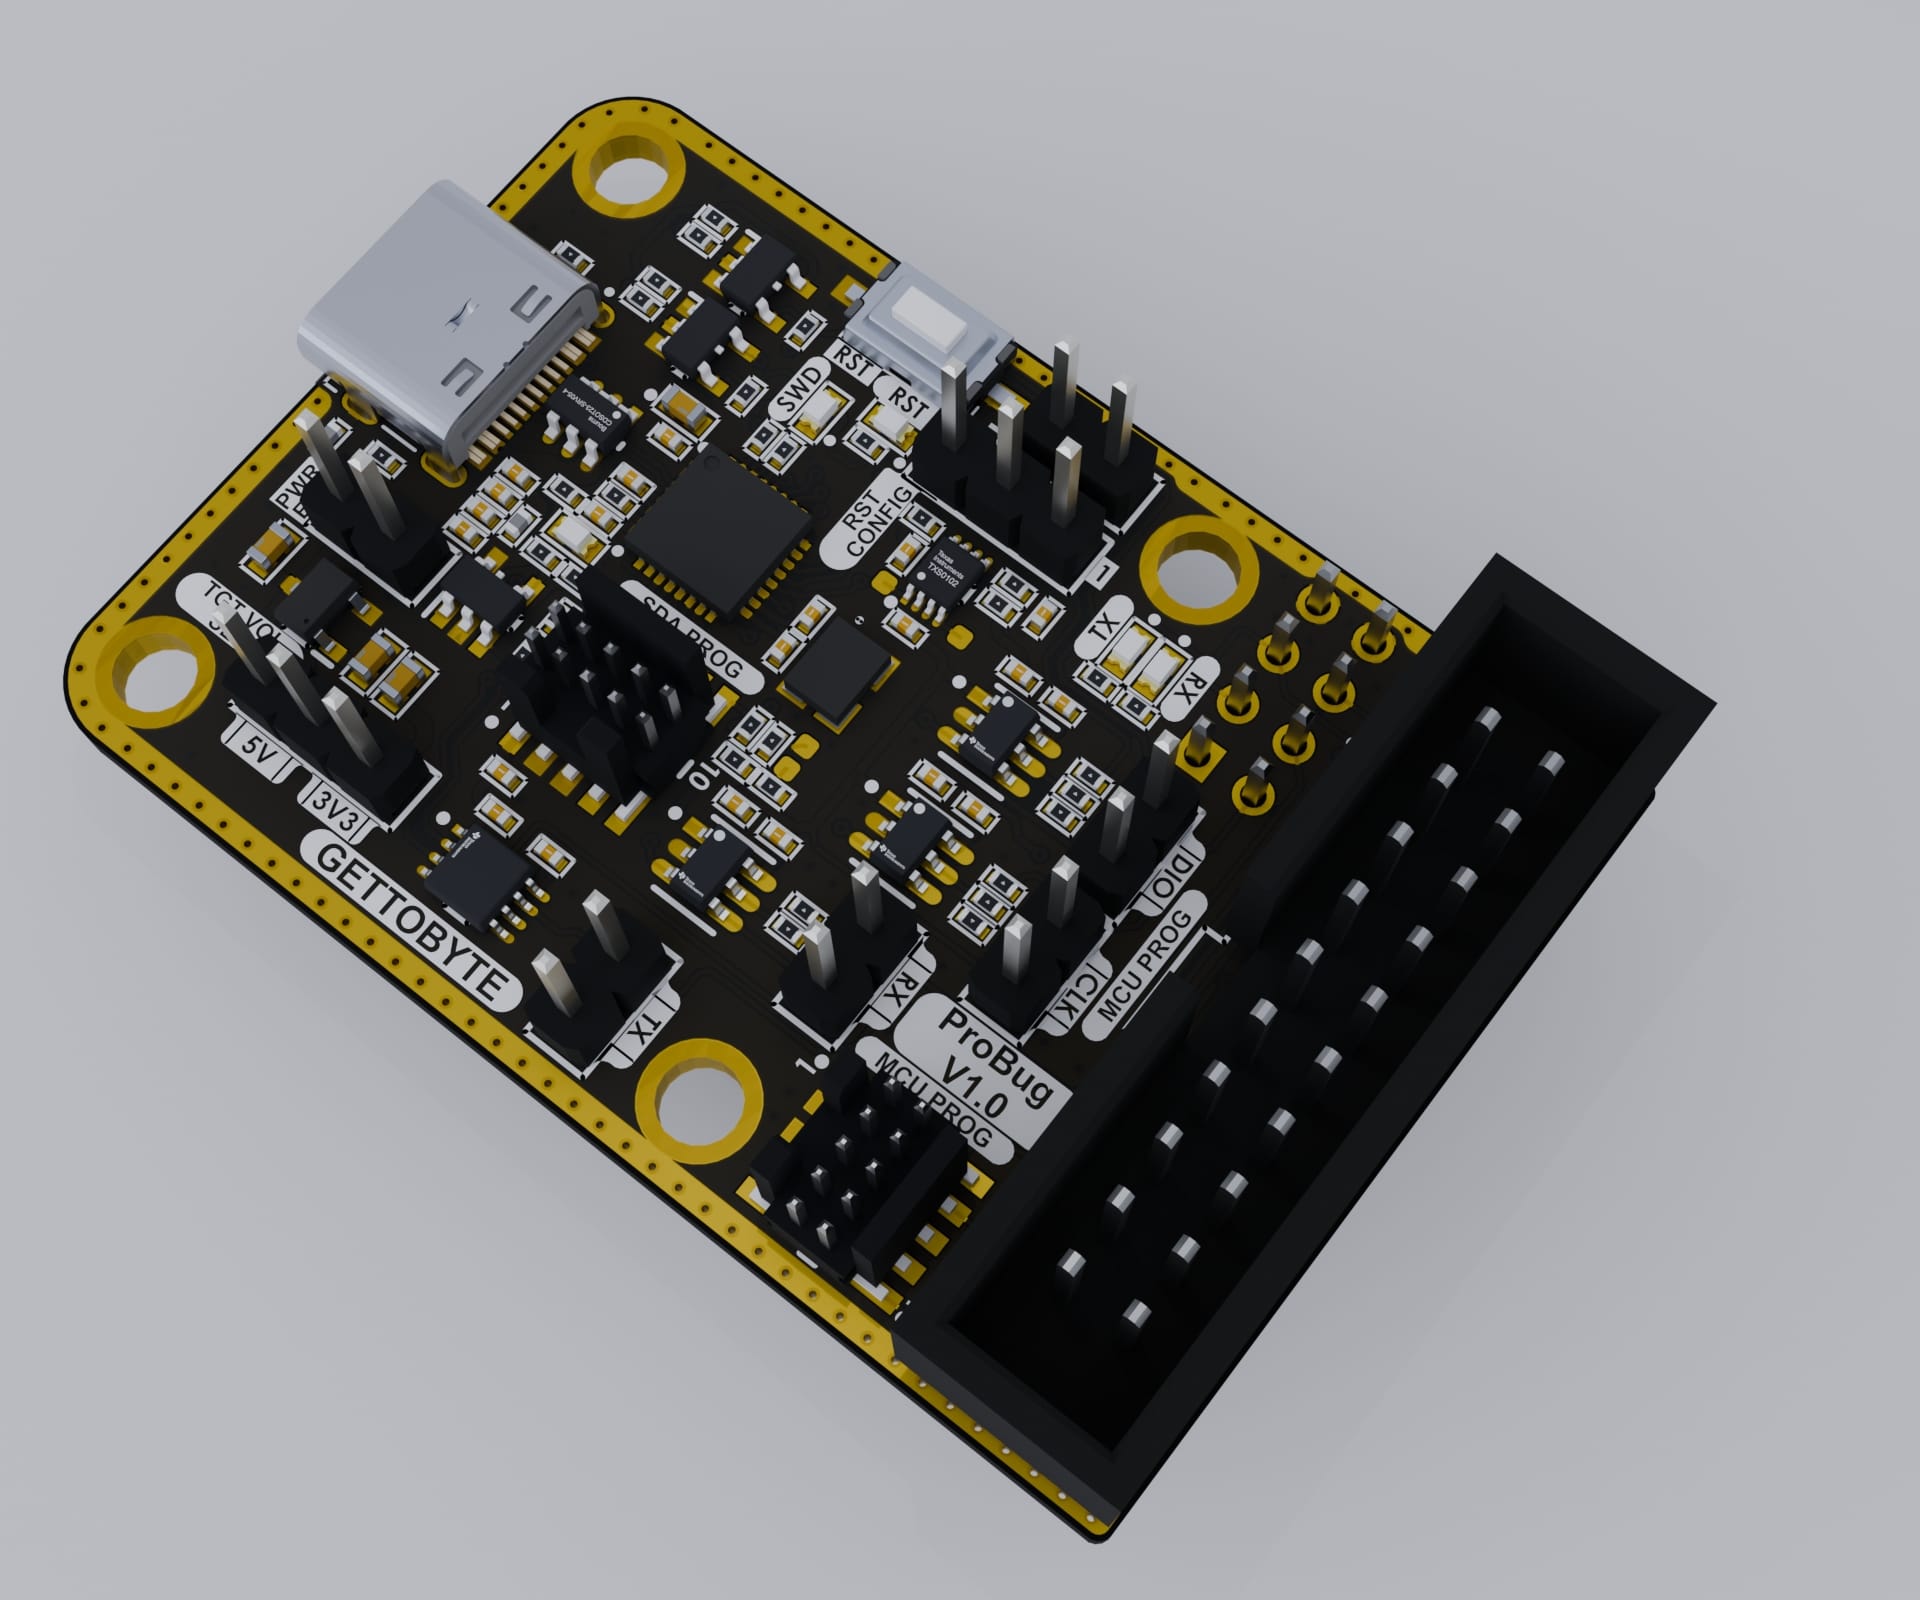
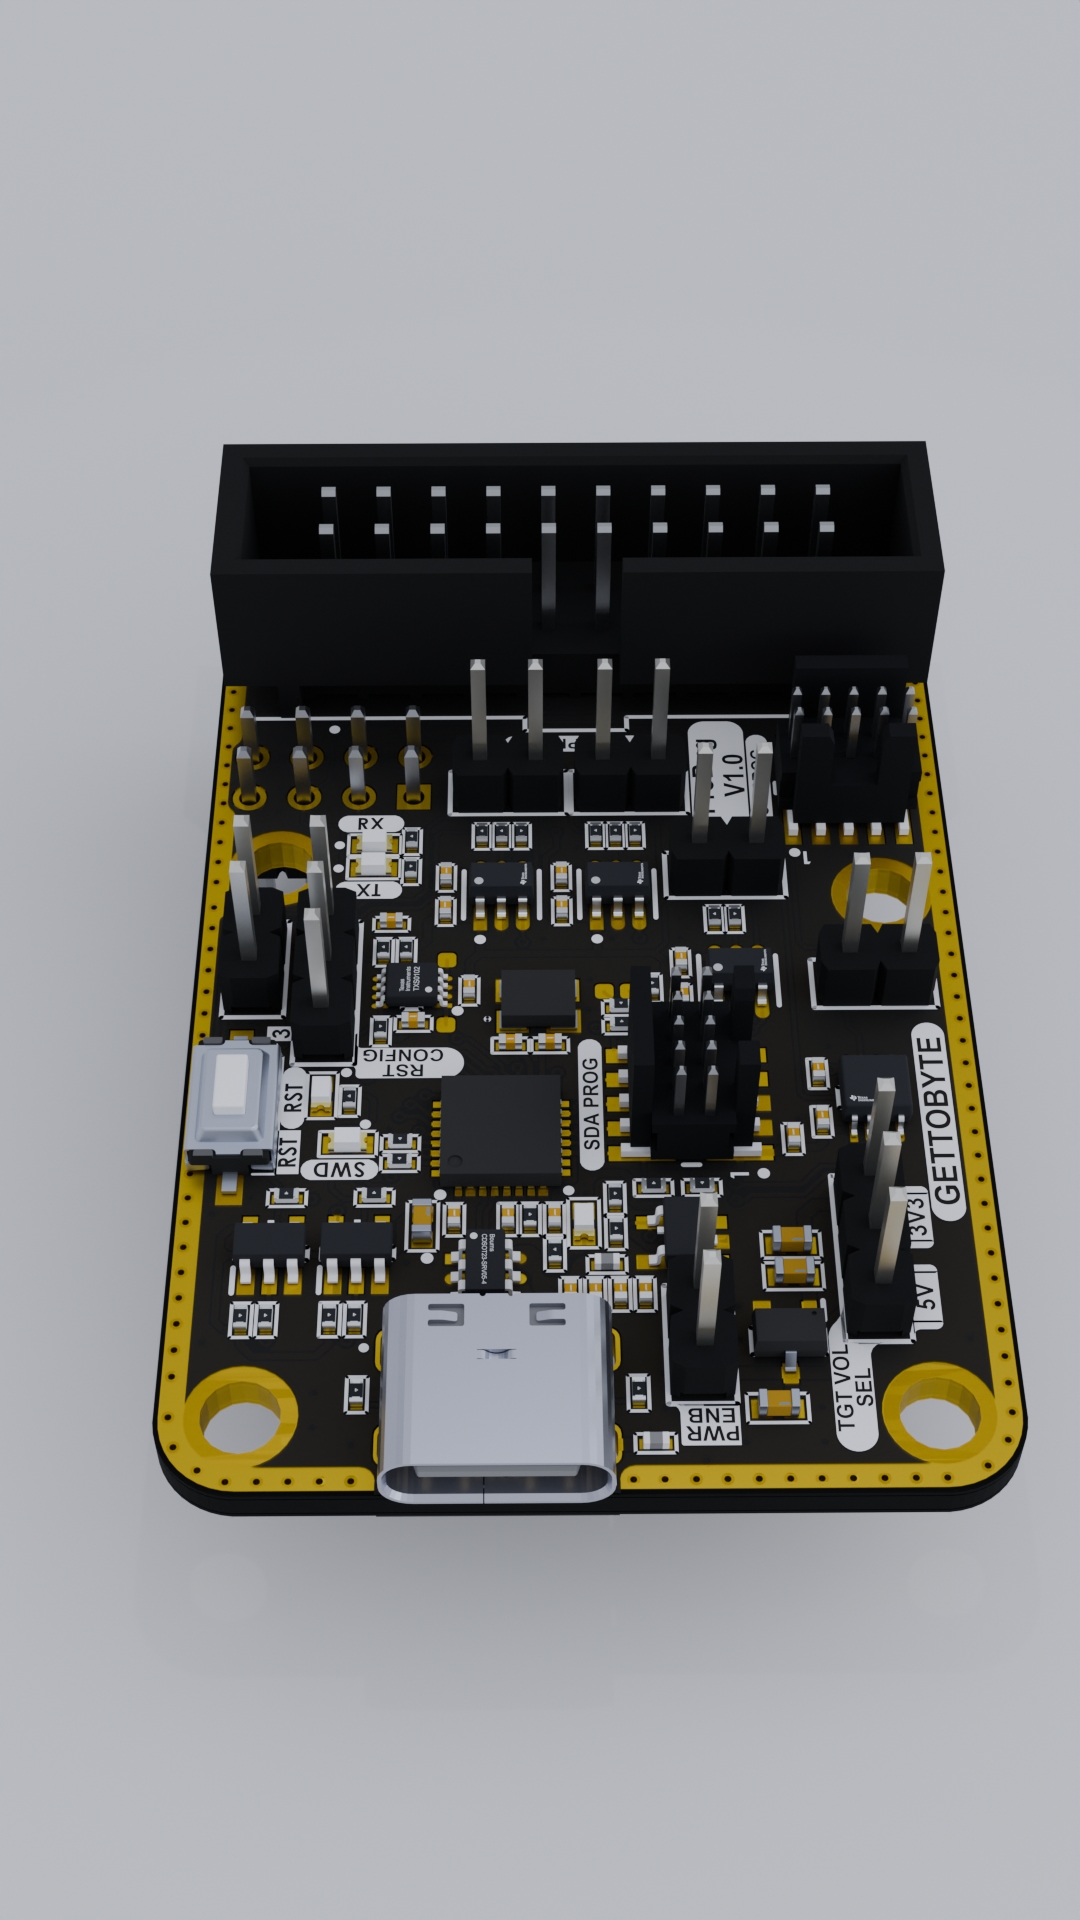
The ProBug Debugger is a cost-effective and reliable tool designed for debugging and programming NXP Semiconductors S32K Platform microcontrollers. This versatile device is compatible with all microcontrollers in the S32K Platform that are based on ARM Cortex M series processors, including ARM Cortex M0/M3/M4/M7, and more. The supported SoC names include S32K1xx and S32K3xx.
Utilizing the SWD interface, the ProBug Debugger seamlessly connects with target S32K microcontrollers. It can be easily integrated into the programming and debugging process of S32K microcontrollers using S32 Design Studio as a Jlink Debugger Debug Configuration. The ProBug Debugger operates on the SWD interface, similar to a Jlink Debugger, and can be utilized with Jlink Software Toolchain configurations in various IDEs for NXP S32K Series MCUs.
The ProBug Debugger is designed for user convenience, featuring two debug connectors that allow for easy connection to NXP Semiconductors S32K microcontrollers via a 20-pin JTAG connector or a 10-pin SWD connector. The device is powered by connecting it to a host desktop or laptop using a Type C cable. Additionally, the ProBug Debugger can be configured to power the host S32K microcontroller by adjusting its power configuration header to either 5V or 3.3V.
Furthermore, the ProBug Debugger includes a Virtual UART Com Port, enabling real-time data logging via a UART peripheral through the same debug connector. To determine which UART port to use for this Virtual Com Port, consult the corresponding SoC Reference Manual or the User Guide of the Gettobyte Embedded Hardware Kits.
The ProBug Debugger is an innovative tool designed specifically for programming and debugging ARM Cortex M processor-based microcontrollers, particularly for the NXP S32K platform. Unlike the original Jlink and Pe Micro Debugger, the ProBug Debugger is available at a fraction of the cost, making it more accessible to a wider audience, especially in academia.
Unlike Chinese JlinkV9 Debuggers, which are often unreliable and limited to ARM Cortex M4 processors, the ProBug Debugger stands out as a reliable and cost-effective alternative. It is not a mere clone of Jlink Debuggers, but a uniquely designed tool based on OpenSDAv2.0 with a reliable Jlink Bootloader, ensuring consistent performance similar to that of the original Jlink Debuggers.
In conclusion, the ProBug Debugger offers a reliable and affordable solution for programming and debugging NXP S32K microcontrollers, making it an ideal choice for developers and learners alike.
Convenient operation, convenient connection, simple and easy to learn, it is the best and most practical development tool for learning and developing ARM.
Hardware Features:
– Configurable power supply over JTAG at 5V and 3.3V.
– Elimination of JTAG to SWD adapter boards with standard 20P JTAG and 10P 1.27mm SWD connectors.
– USB to UART converter functionality, allowing for programming, debugging, and data transmission via serial monitor on any PC or laptop.
Software Features:
- Can be used with S32 Design Studio to program/debug all NXP S32K1xx and S32K3xx Microcontrollers.
- Can be used with other NXP and Ancit Embedded Software Toolchains like: FreeMaster/MBDT/S32 Design Studio/S32 Flash Tool/ S32 Power Analyzer Tool as Jlink Debugger configuration.
- Fully compatible with Seger Jlink Software Toolchain for command line debugging/programing and analyzing.
Package Contents:
- 1 x ProBug Debugger
- 10 pin SWD-JTAG connector Pin
NXP S32Kxx SoC tested with:
- S32K144: ElecronivsV2 Development Board – Get To Byte
- S32K148: VehronicsV1(S32K148) – Get To Byte
- S32K312:
- S32K344: AutoBoardV1 Development Board – Get To Byte
Other References:
Documents:
- User Guide
- Getting Started Manual
additional information
| Weight | .25 kg |
|---|---|
| Dimensions | 12 × 12 × 6 cm |


Reviews
There are no reviews yet.